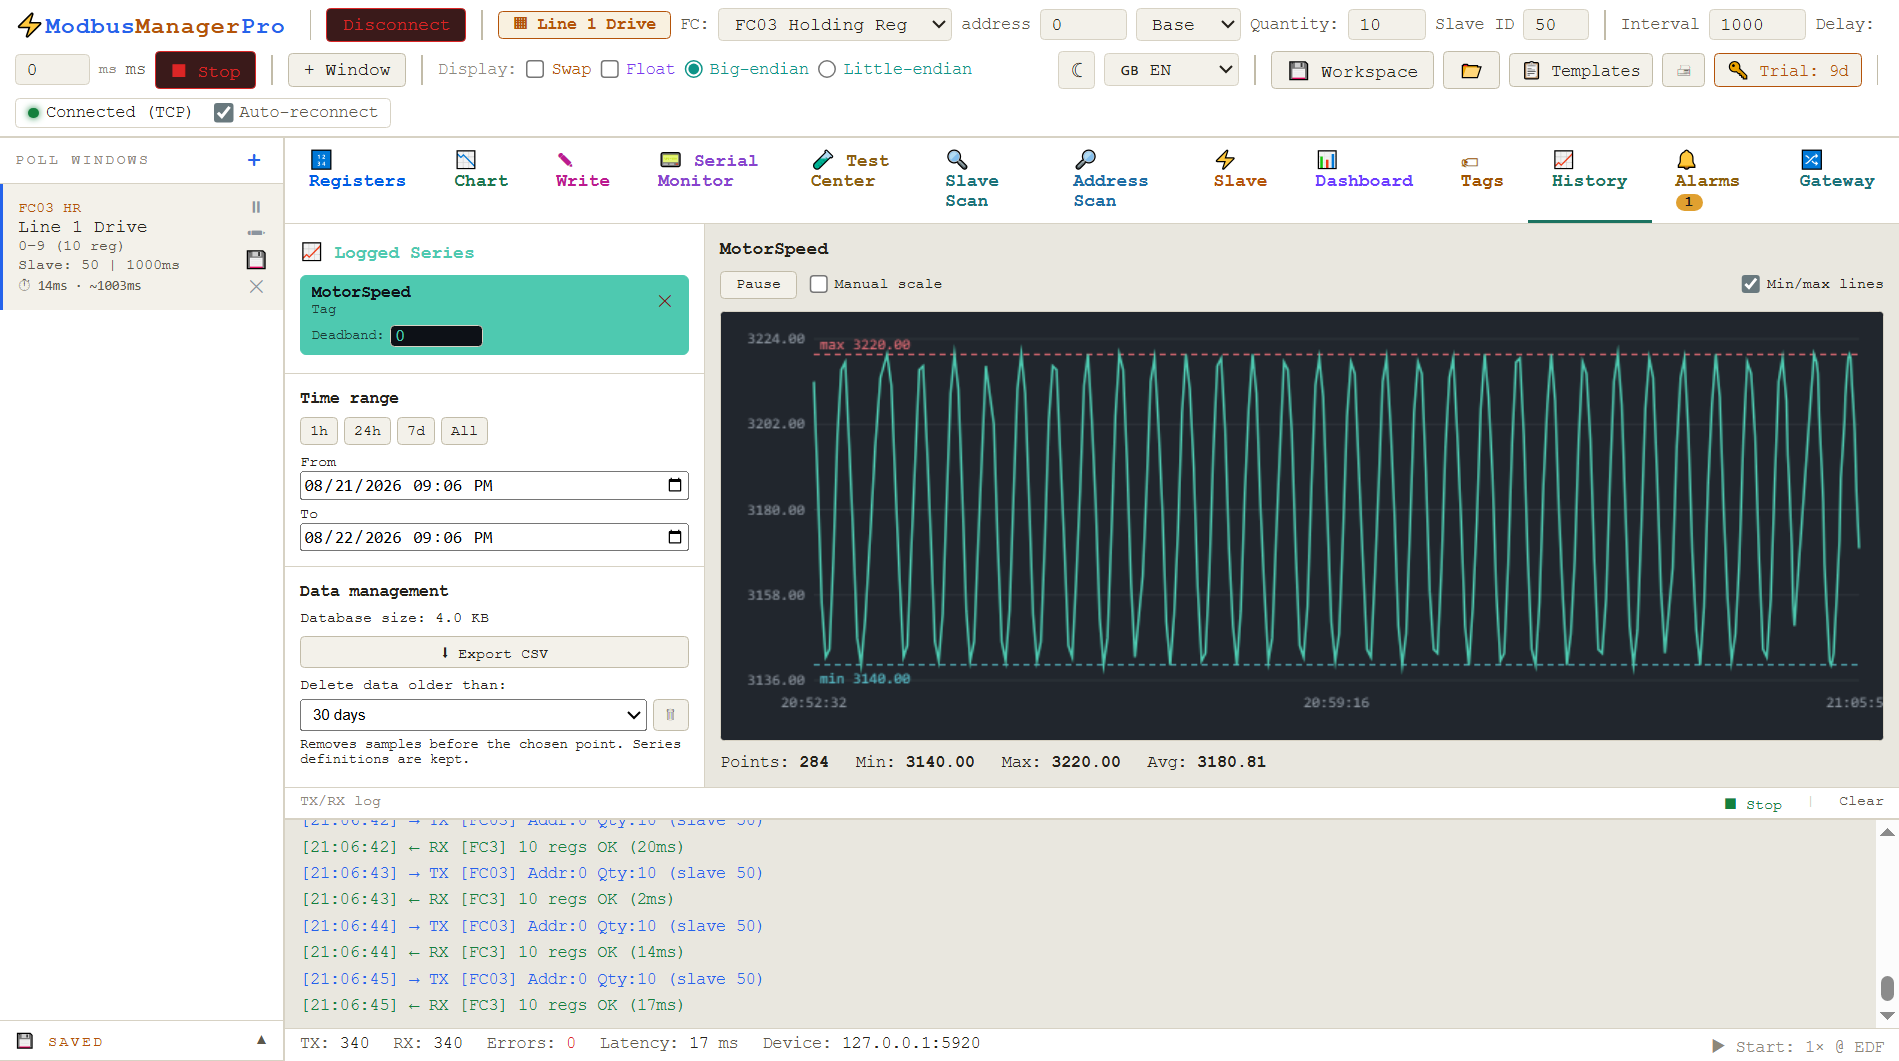
Record Modbus register and tag values to a local database and review them over time — trend charts, selectable time ranges, deadband and one-click CSV export. A built-in historian with no cloud and no separate server. Works with RTU and TCP devices on Windows 10/11.
No credit card for trial · Windows 10/11 · One-time license
// what is modbus data logging
Turn live registers into history
A Modbus poll shows you the value now. A Modbus logger answers the questions that come later: what happened overnight, when did the value spike, is the trend drifting?
ModbusManager Pro records the values you choose to a local database, so you can scroll back through hours, days or weeks of real device data without standing up a full SCADA or historian system. Logging starts with a single click from any poll window or tag, and the data is stored on your own PC in a compact SQLite database — no cloud account, no subscription, no separate server to maintain.
// what the historian does
Everything you need to log and review
Capture the signals that matter, keep the database lean, and get the data back out whenever you need it.
📈
Trend charts
Plot any logged series over time with selectable ranges — last hour, 24 hours, 7 days, everything, or a custom window.
🏷
Registers & tags
Log raw registers or named tags. Combine signals from multiple slaves and both RTU and TCP devices in one history.
🎚
Deadband
Store a value only when it changes by more than a set amount — keeps slow signals compact and the database lean.
📊
Live statistics
See min, max, average and sample count for each series at a glance, recalculated as new data arrives.
📤
CSV export
Export any series to CSV and open it in Excel, Google Sheets or your analysis tool of choice.
💾
Local & offline
Data lives in a local SQLite database on your machine. No cloud, no account, no internet dependency.
// how to log modbus data
Three steps from device to history
If you can poll a device, you can log it. No scripting required.
Step 1
Poll your device
Connect over Modbus RTU or TCP and set up the registers you want to read, exactly as you would for normal polling in ModbusManager.
Step 2
Start logging
Click the Log button on a poll window or tag. Optionally set a deadband to control how much data is stored for that series.
Step 3
Review & export
Open the History tab to see trend charts and statistics, pick a time range, and export to CSV when you need to share or analyse the data.
A logged series, with min/max lines and a selectable time range
// serial lines
Modbus RTU data logger over RS-485
Most plant data still arrives over a two-wire RS-485 line rather than Ethernet. A serial
Modbus logger has constraints an Ethernet one does not, and they decide how often you can
realistically sample.
One line, many devices
RS-485 is half duplex: one request and one reply at a time, in turn. Twenty meters on a
shared line at 9600 baud cannot each be read every second. ModbusManager polls the
whole line from a single register map and gives every window its own interval, so a slow
energy meter and a fast drive can sit on the same bus without one starving the other.
What the line can carry
A rough figure worth knowing before you set an interval: at 9600 baud one short
read plus its reply takes roughly 30–60 ms including the silent gap between
frames. Thirty reads per cycle therefore needs about two seconds, and asking for one
second will simply build a backlog. At 115200 baud the same cycle is comfortable.
When a device stops answering
On a serial line one silent slave delays everything behind it, because the master waits
out the timeout before moving on. The Serial Monitor shows the raw request and reply
bytes, so you can tell a wiring fault from a wrong unit ID or a mismatched baud rate
instead of guessing at it.
RTU and TCP together
A commissioning job rarely stays on one transport. The same Modbus logger handles RTU on
a COM port, ASCII, and TCP over Ethernet, and the history is stored the same way for all
three — so a serial meter and an Ethernet PLC end up in one exportable record.
Serial lines have enough of their own arithmetic to deserve a page of it:
covers frame timing at each baud rate, realistic intervals for a full device list, and how to
tell a wiring fault from a wrong unit ID.
// where it helps
Typical uses
Commissioning and fault-finding — capture a device’s behaviour over a shift and review exactly what happened. Long-term monitoring — track temperatures, pressures, energy or flow and spot slow drift. Acceptance testing — record values during a test run and export the evidence. Energy and process studies — log consumption or production figures and analyse them in a spreadsheet. Anywhere you would otherwise reach for a separate data-logging tool, the built-in Historian keeps it in one application.
// standard vs pro
Which edition do you need?
Both editions include the full Modbus master and slave toolset. Pro adds the Historian, Dashboard HMI and alarms on top.
A data logger is only useful if you can trust the time column six months later. Here is what
gets written and what to decide before you start a long run.
Decision
Why it matters later
Logging interval
Each poll window keeps its own interval. Sample fast enough to see the event you care about, and no faster — a one-second interval on thirty registers is roughly 2.6 million rows a month per register.
Deadband
Write a row only when the value moves by more than a set amount. On a steady process this is the difference between a database that stays small and one that fills a disk with identical readings.
Timestamp source
The time recorded is the PC clock at the moment the reply arrived, not a clock inside the device. On a long unattended run, make sure the logging PC has time sync enabled, or the record will drift away from every other system you compare it against.
Gaps
A missing row is information. If a device went silent or the cable was pulled, the history shows the gap rather than repeating the last known value — so an outage does not read as a flat, healthy signal.
Getting data out
History is kept in a local SQLite file on your own machine — no cloud account, no server to run. Pick a time range and export to CSV for Excel, a report, or a handover pack.
// in more detail
Three things worth getting right first
Each of these has enough detail to deserve its own page, and each one is where a logging run usually goes wrong.
Can it work as a Modbus RTU datalogger on an RS-485 line?+
Yes. The same Modbus datalogger reads RTU and ASCII over a COM port and TCP over Ethernet, and stores all of them the same way. On a shared RS-485 line each poll window keeps its own interval, so a slow energy meter and a fast drive can share one bus. At 9600 baud a short read plus its reply takes roughly 30–60 ms, which is what limits how often a long device list can realistically be sampled.
Can ModbusManager log Modbus data to a file?+
Yes. ModbusManager Pro includes a built-in Historian that logs register and tag values to a local SQLite database. You can review the data as trend charts and export any series to CSV for use in Excel or other tools.
Does the Modbus data logger work offline?+
Yes. The Historian stores data in a local database on your PC. No cloud account, internet connection or separate historian server is required — everything runs inside the application.
How do I reduce the amount of logged data?+
Each logged series supports a deadband: a value is only stored when it changes by more than the deadband amount. This keeps slow-moving signals compact while still capturing meaningful changes.
Can I export logged Modbus values to Excel?+
Yes. Any logged series can be exported to a CSV file, which opens directly in Excel, Google Sheets or any analysis tool.
Is data logging available in the free Standard edition?+
The Historian is a Pro-edition feature. ModbusManager Standard ($49) covers polling, slave mode and simulation; the Historian and alarm system are part of Pro ($119).
// logging many devices
Log a whole installation from one map
Logging becomes simpler when the values you want already sit in one place. The gateway can collect registers from every device — RTU and TCP together — into one common register map, with engineering units applied. The Historian then logs a tidy, consistent address range instead of chasing scattered devices and mismatched data types.