What Is a Workspace? Open One, Connect It, Save Your Own
A workspace is one .json file that holds a complete ModbusManager setup: the poll windows, the dashboard, the tags and the script. The device guides on this site each come with a free one — open it, point it at your own device, and the dashboard comes alive without building anything. This page explains what is inside the file, the three ways to open one, what to set after opening, and how to save and move your own.
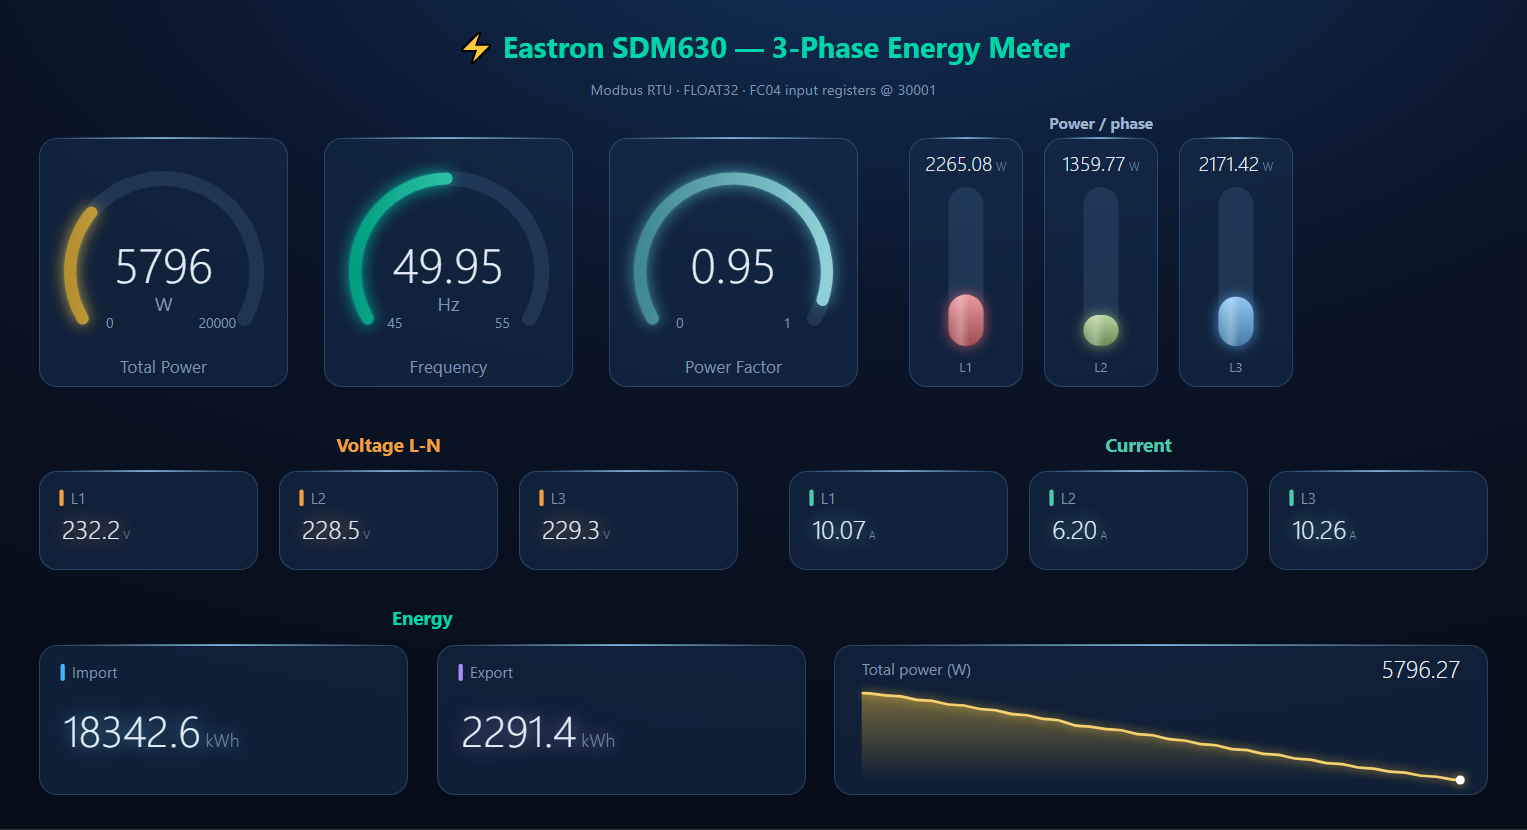
What Is in a Workspace — and What Is Not
A workspace describes what to read and how to show it. It does not describe where the device is: the connection belongs to the PC, because the same meter is on COM3 on one laptop and COM7 on the next.
| Saved in the workspace | Not in the workspace |
|---|---|
| Poll windows (function code, address, quantity, Slave ID, interval) with their descriptions, Value Names, conditional colours, chart series and slave blocks | Connection settings — COM port, baud rate, IP address. Each PC keeps its own. |
| Pro: the dashboard — pages, elements, theme, effects, background | Alarm definitions of the Alarms tab and the S7 PLC list (the application keeps those) |
| Pro: tags, the Structured Text script and its interval | Simulations running on slave registers |
| Pro: which series the Historian logs, and the gateway configuration (opening asks before applying it) | Recorded history — the logged values stay in the Historian database |
So a workspace from this site never connects to anything by itself. It waits for you to choose the port or address.
Three Ways to Open a Ready Workspace
1. “Open in ModbusManager Pro” on a device guide
Every device guide with a free workspace has this button next to the download. It opens the workspace straight in ModbusManager Pro on your PC (version 1.9.9 or newer) — no file to find afterwards.

2. The Device library inside the app
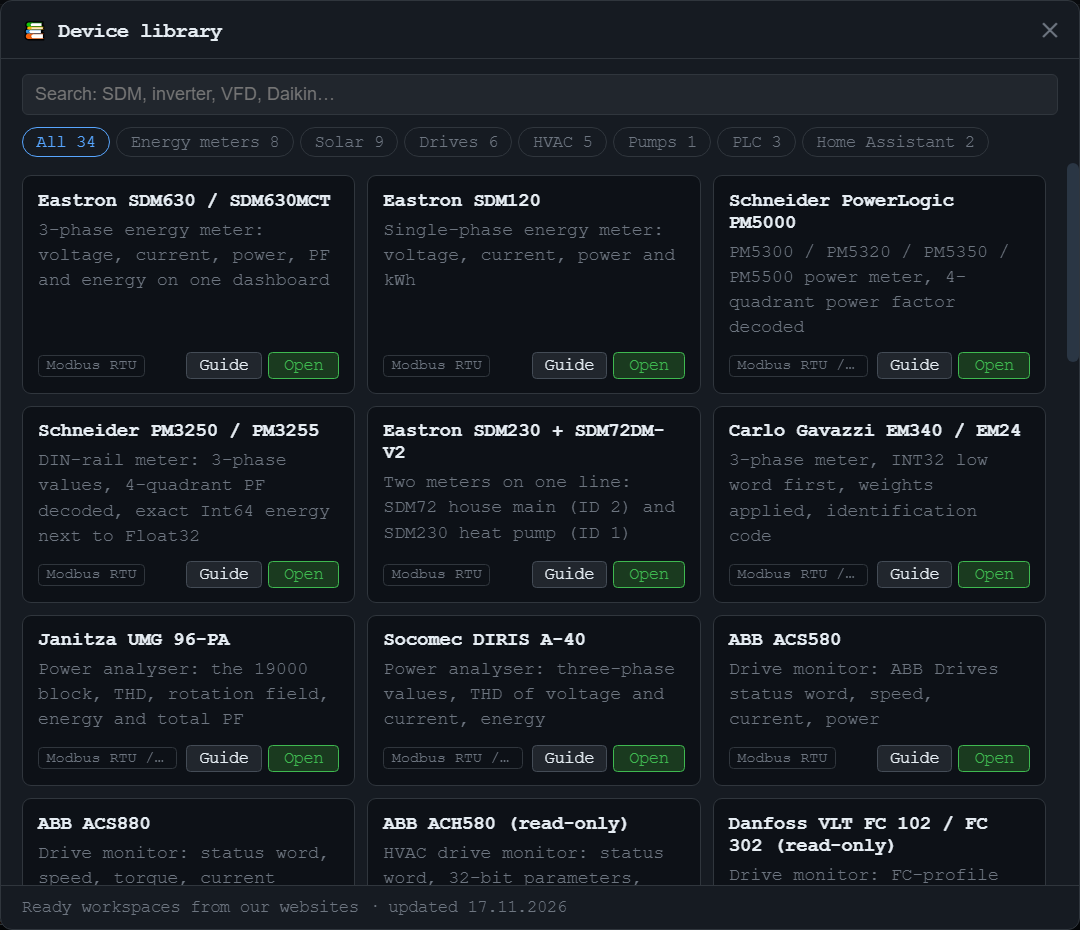
The 📚 button in Pro's toolbar lists every ready workspace from modbusmanager.com and bacmanager.com, with a search and categories: energy meters, solar, drives, HVAC, pumps, PLCs, Home Assistant. Guide opens the device's page; Open loads the workspace. New devices appear in the list as soon as their guide is published — no app update needed — and the last list is kept for use offline.
3. A downloaded .json file
Downloaded the file instead? Press 📂 in the toolbar. The list shows the workspaces in your Documents folder; for a file anywhere else — Downloads, a USB stick, an e-mail attachment — press Browse… and pick it.
Before anything is replaced
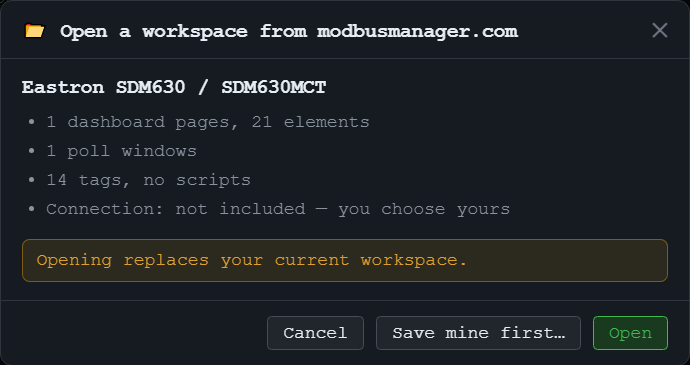
The first two ways show what the workspace holds before it loads — pages and elements, poll windows, tags, whether it has a script — and say plainly that no connection comes with it. Opening replaces the workspace you have open, so Save mine first… is right there.
After Opening: Connect It to Your Device
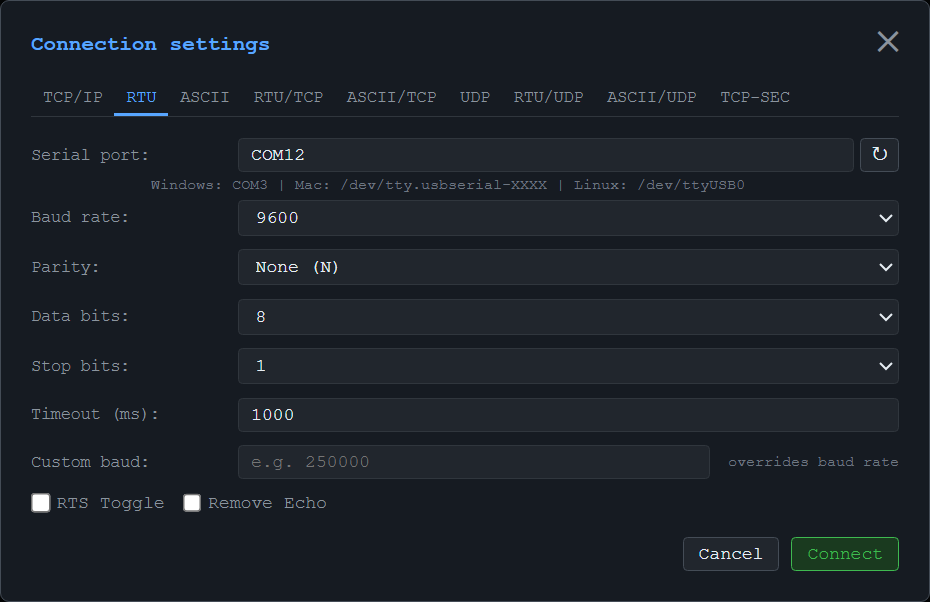
The workspace knows the registers; you supply the wire. The device guide the workspace belongs to lists the serial settings and the Modbus address the workspace expects.
- Connect → choose RTU for an RS-485 device (USB adapter, COM port) or TCP/IP for a device on the network.
- Enter the COM port and the device's baud rate, parity, data and stop bits — or its IP address and port 502 — and press Connect.
- Press ▶ Start to poll, and open the Dashboard tab. The elements fill in within a second or two.
A different Modbus address? The free workspaces read the device at the address its maker ships it with (usually 1; the guide says). If yours is set to another one, the quickest fix is to set the device to the workspace's address. Otherwise change Slave ID in the poll window and in each tag on the Tags tab, then save the workspace under your own name.
Values look wrong? Nonsense numbers usually mean an address offset or the word order of 32-bit values, not a broken device. The device guides list both, and the Modbus Scanner page shows how to find them on a device without documentation.
Save Your Own Workspace
Once the dashboard shows your plant, press 💾 Workspace and give it a name. It is saved to your Documents folder, and 📂 lists it the next time. When you close ModbusManager, it asks whether to save the workspace.
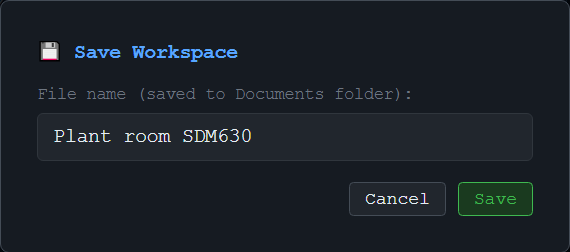
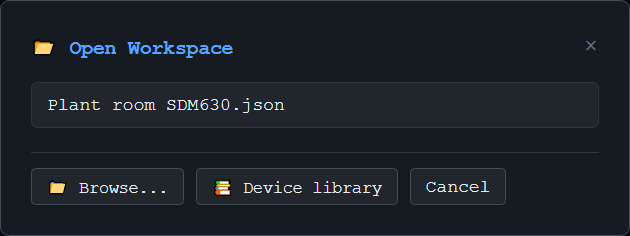
To another PC, copy the .json file — e-mail, USB stick, a shared folder — and open it there with 📂 → Browse…. Only the connection has to be chosen again, because it stayed with the first PC.
For an operator screen, the same workspace becomes a Runtime package: a locked, dashboard-only screen for an operator PC.
BACnet too: ModbusManager Pro and BACManager open each other's workspaces.
Where the Ready Workspaces Are
Every device guide with a dashboard picture has its workspace: Eastron, Schneider, Janitza and Carlo Gavazzi meters, Huawei, Sungrow, SunSpec and GoodWe inverters, ABB, Danfoss, Schneider and Siemens drives, Grundfos pumps, Siemens S7 PLCs and more. The user manual has the full reference.
Open a ready workspace in ModbusManager Pro
Device library, dashboards and tags included in the free 14-day trial. No credit card. Windows 10/11.
Frequently Asked Questions
What is a ModbusManager workspace?
One JSON file with a complete setup: the poll windows, and in Pro the dashboard, tags, script, Historian series and gateway configuration. Opening it restores all of that at once.
Does a workspace contain my COM port or IP address?
No. Connection settings stay with each PC, so a workspace from the website or from a colleague never connects anywhere by itself. You choose the port or address after opening it.
Where are workspaces saved?
In your Documents folder. The 📂 button lists the workspaces there; Browse… opens one from any other folder.
How do I open a workspace from a device guide?
Press Open in ModbusManager Pro on the guide (Pro 1.9.9 or newer), or find the device in the app's 📚 Device library and press Open. Both show what the workspace holds and ask before replacing yours.
My device has a different Modbus address. What do I change?
Either set the device to the address the workspace uses (the guide says which), or change Slave ID in the poll window and in each tag on the Tags tab, then save the workspace under your own name.
Can BACManager open a ModbusManager workspace?
Yes. ModbusManager Pro and BACManager open each other's workspaces, so a BACnet and Modbus site can share one file.
Sources
All screenshots from the released ModbusManager Pro 1.9.10, with a scratch user profile, the live Device library list, and a simulated Eastron SDM630 on a virtual RS-485 port. What a workspace holds: the ModbusManager user manual, section Workspaces & templates.